Wi-fi is now ubiquitous in most populated areas, and the way the devices communicate leaves a lot of 'digital exhaust'. Usually a computer will have a Wi-Fi device that’s configured to connect to a given network, but often these devices can be configured instead to pick up the background Wi-Fi chatter of surrounding devices.
There are good reasons—and bad—for doing this. Just like taking apart equipment to understand how it works teaches us things, so being able to dissect and examine protocol traffic lets us learn about this. However, by collecting this type of traffic it can be possible to track and analyse behaviour in ways that we may or may not feel comfortable with. Improving public transport? Sure. Tracking shopper behaviour? Meh, less sure.
So, here’s how to do it, and go ahead and make sure you’re doing it for the right reasons. A plague o' your house if you don’t!
Kit list #
-
Raspberry Pi Model B Rev 2, 512MB, running Raspbian GNU/Linux 10 (buster)
I had the Raspberry Pi plugged into my network on its Ethernet port, since the Wi-Fi dongle will be otherwise occupied :)
Set up the wireless interface #
First up, delete the existing wireless network interface that’s probably there already:
sudo iw dev wlan0 delCheck that that Wi-Fi physical device supports monitor mode (which is what we’re using), and make a note of its name (here, phy0):
$ sudo iw phy
Wiphy phy0
	max # scan SSIDs: 4
	max scan IEs length: 2257 bytes
…
	Supported interface modes:
		 * IBSS
		 * managed
		 * AP
		 * AP/VLAN
		 * monitor
		 * mesh point
…
Now create a new monitoring interface (type monitor) bound to the physical device (phy0), and bring it up.
sudo iw phy phy0 interface add mon0 type monitor
sudo ifconfig mon0 up
If you check its status you should see it in monitor mode:
$ iwconfig mon0
mon0      IEEE 802.11  Mode:Monitor  Frequency:2.417 GHz  Tx-Power=20 dBm
          Retry short  long limit:2   RTS thr:off   Fragment thr:off
          Power Management:off
You should have a network config that looks something like this - a loopback (lo), a network connection to your LAN (eth0), and a monitor interface (mon0):
$ ip a
1: lo: <LOOPBACK,UP,LOWER_UP> mtu 65536 qdisc noqueue state UNKNOWN group default qlen 1000
    link/loopback 00:00:00:00:00:00 brd 00:00:00:00:00:00
    inet 127.0.0.1/8 scope host lo
       valid_lft forever preferred_lft forever
    inet6 ::1/128 scope host
       valid_lft forever preferred_lft forever
2: eth0: <BROADCAST,MULTICAST,UP,LOWER_UP> mtu 1500 qdisc pfifo_fast state UP group default qlen 1000
    link/ether b8:27:eb:3f:dc:66 brd ff:ff:ff:ff:ff:ff
    inet 192.168.10.106/24 brd 192.168.10.255 scope global noprefixroute eth0
       valid_lft forever preferred_lft forever
    inet6 fd00::1:6332:fcea:9237:246c/64 scope global dynamic mngtmpaddr noprefixroute
       valid_lft 7158sec preferred_lft 7158sec
    inet6 fe80::8b6b:8c75:94a0:1aac/64 scope link
       valid_lft forever preferred_lft forever
4: mon0: <BROADCAST,MULTICAST,PROMISC,UP,LOWER_UP> mtu 1500 qdisc mq state UNKNOWN group default qlen 1000
    link/ieee802.11/radiotap 00:0f:60:04:ef:a4 brd ff:ff:ff:ff:ff:ff
Here comes the tools #
Let’s install some useful things:
sudo apt-get install -y tcpdump tshark jq kafkacatCheck everything’s working by running tcpdump to dump out the Wi-Fi traffic as it’s received:
$ sudo tcpdump -i mon0 -n
tcpdump: verbose output suppressed, use -v or -vv for full protocol decode
listening on mon0, link-type IEEE802_11_RADIO (802.11 plus radiotap header), capture size 262144 bytes
10:36:49.640924 1.0 Mb/s 2417 MHz 11b -81dBm signal antenna 1 Data IV:28ee Pad 20 KeyID 2
10:36:55.497519 1.0 Mb/s 2417 MHz 11b -77dBm signal antenna 1 Probe Request (RNM0) [1.0 2.0 5.5 11.0 Mbit]
10:36:57.511322 1.0 Mb/s 2417 MHz 11b -69dBm signal antenna 1 Probe Request (RNM0) [1.0* 2.0* 5.5* 6.0 9.0 11.0* 12.0 18.0 Mbit]
10:36:57.512419 1.0 Mb/s 2417 MHz 11b -69dBm signal antenna 1 Probe Request () [1.0* 2.0* 5.5* 6.0 9.0 11.0* 12.0 18.0 Mbit]
10:36:57.679522 1.0 Mb/s 2417 MHz 11b -67dBm signal antenna 1 Acknowledgment RA:48:d3:43:xx:xx:xx
There’s five packets of real live Wi-Fi data! And there’s a bunch you can do with tcpdump and filters etc, but because we want this data out in a structured manner (i.e. key/values) I’m going to cut over to tshark now.
tshark is the CLI companion to the well known network tool, Wireshark. You can use it standalone, or you can even use it as a source for Wireshark - which is pretty cool.
Let’s start with a quick tshark:
$ sudo tshark -i mon0
Running as user "root" and group "root". This could be dangerous.
Capturing on 'mon0'
    1 0.000000000 Apple_17:17:d3 → Broadcast    802.11 175 Probe Request, SN=672, FN=0, Flags=........, SSID=RNM0
    2 0.009712480 Apple_17:17:d3 → Broadcast    802.11 175 Probe Request, SN=673, FN=0, Flags=........, SSID=RNM0
    3 20.711944424 66:9f:b3:xx:xx:xx → Broadcast    802.11 106 Probe Request, SN=772, FN=0, Flags=........, SSID=Wildcard (Broadcast)
    4 20.719399794              → Bskyb_13:16:82 (3c:89:94:xx:xx:xx) (RA) 802.11 28 Acknowledgement, Flags=........
There’s that Wi-Fi data again!
But how to get this data out in a truly structured way that’s going to be useful in subsequent processing?
Writing structured JSON from tshark #
As you can see from above tshark by default writes data in a loosely-structured way that would be impossible to parse programatically. We want a structured format such as JSON, and that’s kind of possible with the -T flag and ek argument:
$ sudo tshark -i mon0 -T ek
Running as user "root" and group "root". This could be dangerous.
Capturing on 'mon0'
{"index" : {"_index": "packets-2020-03-11", "_type": "pcap_file"}}
{"timestamp" : "1583923701818", "layers" : {"frame": {"frame_frame_interface_id": "0","frame_interface_id_frame_interface_name": "mon0","frame_frame_encap_type": "23","frame_frame_time": "Mar 11, 2020 10:48:21.818766344 GMT","frame_frame_offset_shift": "0.000000000","frame_frame_time_epoch": "1583923701.818766344","frame_frame_time_delta": "0.000000000","frame_frame_time_delta_displayed": "0.000000000","frame_frame_time_relative": "0.000000000","frame_frame_number": "1","frame_frame_len": "28","frame_frame_cap_len": "28","frame_frame_marked": "0","frame_frame_ignored": "0","frame_frame_protocols": "radiotap:wlan_radio:wlan"},"radiotap": {"radiotap_radiotap_version": "0","radiotap_radiotap_pad": "0","radiotap_radiotap_length": "18","radiotap_radiotap_present": "","radiotap_present_radiotap_present_word": "0x0000482e","radiotap_present_word_radiotap_present_tsft": "0","radiotap_present_word_radiotap_present_flags": "1","radiotap_present_word_radiotap_present_rate": "1","radiotap_present_word_radiotap_present_channel": "1","radiotap_present_word_radiotap_present_fhss": "0","radiotap_present_word_radiotap_present_dbm_antsignal": "1","radiotap_present_word_radiotap_present_dbm_antnoise": "0","radiotap_present_word_radiotap_present_lock_quality": "0","radiotap_present_word_radiotap_present_tx_attenuation": "0","radiotap_present_word_radiotap_present_db_tx_attenuation": "0","radiotap_present_word_radiotap_present_dbm_tx_power": "0","radiotap_present_word_radiotap_present_antenna": "1","radiotap_present_word_radiotap_present_db_antsignal": "0","radiotap_present_word_radiotap_present_db_antnoise": "0","radiotap_present_word_radiotap_present_rxflags": "1","radiotap_present_word_radiotap_present_xchannel": "0","radiotap_present_word_radiotap_present_mcs": "0","radiotap_present_word_radiotap_present_ampdu": "0","radiotap_present_word_radiotap_present_vht": "0","radiotap_present_word_radiotap_present_timestamp": "0","radiotap_present_word_radiotap_present_he": "0","radiotap_present_word_radiotap_present_he_mu": "0","radiotap_present_word_radiotap_present_reserved": "0x00000000","radiotap_present_word_radiotap_present_rtap_ns": "0","radiotap_present_word_radiotap_present_vendor_ns": "0","radiotap_present_word_radiotap_present_ext": "0","radiotap_radiotap_flags": "0x00000000","radiotap_flags_radiotap_flags_cfp": "0","radiotap_flags_radiotap_flags_preamble": "0","radiotap_flags_radiotap_flags_wep": "0","radiotap_flags_radiotap_flags_frag": "0","radiotap_flags_radiotap_flags_fcs": "0","radiotap_flags_radiotap_flags_datapad": "0","radiotap_flags_radiotap_flags_badfcs": "0","radiotap_flags_radiotap_flags_shortgi": "0","radiotap_radiotap_datarate": "1","radiotap_radiotap_channel_freq": "2417","radiotap_radiotap_channel_flags": "0x000000a0","radiotap_channel_flags_radiotap_channel_flags_turbo": "0","radiotap_channel_flags_radiotap_channel_flags_cck": "1","radiotap_channel_flags_radiotap_channel_flags_ofdm": "0","radiotap_channel_flags_radiotap_channel_flags_2ghz": "1","radiotap_channel_flags_radiotap_channel_flags_5ghz": "0","radiotap_channel_flags_radiotap_channel_flags_passive": "0","radiotap_channel_flags_radiotap_channel_flags_dynamic": "0","radiotap_channel_flags_radiotap_channel_flags_gfsk": "0","radiotap_channel_flags_radiotap_channel_flags_gsm": "0","radiotap_channel_flags_radiotap_channel_flags_sturbo": "0","radiotap_channel_flags_radiotap_channel_flags_half": "0","radiotap_channel_flags_radiotap_channel_flags_quarter": "0","radiotap_radiotap_dbm_antsignal": "-69","radiotap_radiotap_antenna": "1","radiotap_radiotap_rxflags": "0x00000000","radiotap_rxflags_radiotap_rxflags_badplcp": "0"},"wlan_radio": {"wlan_radio_wlan_radio_phy": "4","wlan_radio_wlan_radio_short_preamble": "0","wlan_radio_wlan_radio_data_rate": "1","wlan_radio_wlan_radio_channel": "2","wlan_radio_wlan_radio_frequency": "2417","wlan_radio_wlan_radio_signal_dbm": "-69","wlan_radio_wlan_radio_duration": "272","wlan_radio_duration_wlan_radio_preamble": "192"},"wlan": {"wlan_wlan_fc_type_subtype": "29","wlan_wlan_fc": "0x0000d400","wlan_fc_wlan_fc_version": "0","wlan_fc_wlan_fc_type": "1","wlan_fc_wlan_fc_subtype": "13","wlan_fc_wlan_flags": "0x00000000","wlan_flags_wlan_fc_ds": "0x00000000","wlan_flags_wlan_fc_tods": "0","wlan_flags_wlan_fc_fromds": "0","wlan_flags_wlan_fc_frag": "0","wlan_flags_wlan_fc_retry": "0","wlan_flags_wlan_fc_pwrmgt": "0","wlan_flags_wlan_fc_moredata": "0","wlan_flags_wlan_fc_protected": "0","wlan_flags_wlan_fc_order": "0","wlan_wlan_duration": "0","wlan_wlan_ra": "c8:d1:2a:xx:xx:xx","wlan_wlan_ra_resolved": "Comtrend_96:cc:64","wlan_wlan_addr": "c8:d1:2a:xx:xx:xx","wlan_wlan_addr_resolved": "Comtrend_96:cc:64"}}}
There’s a couple of points to deal with here. The first is that for each packet there are two rows emitted; an index header for Elasticsearch (since ek is designed for ingest into it), and then the full payload. We don’t want the whole payload but just a few columns. We can use the -e parameter to specify the fields that we’re interested in, and a simple grep to drop the Elasticsearch header message. I’ve also added -l to stop the output being buffered:
$ sudo tshark -i mon0 \
            -T ek \
            -l \
            -e wlan.fc.type \
            -e wlan.fc.type_subtype \
            -e wlan_radio.channel | \
grep timestamp{"timestamp" : "1583923966878", "layers" : {"wlan_fc_type": ["1"],"wlan_fc_type_subtype": ["27"],"wlan_radio_channel": ["2"]}}
{"timestamp" : "1583923967196", "layers" : {"wlan_fc_type": ["1"],"wlan_fc_type_subtype": ["27"],"wlan_radio_channel": ["2"]}}
{"timestamp" : "1583923967296", "layers" : {"wlan_fc_type": ["1"],"wlan_fc_type_subtype": ["27"],"wlan_radio_channel": ["2"]}}This is starting to look rather useful. Let’s add in a bit of jq magic to merge the timestamp field in with the rest of the payload which we’ll pull up to the root level:
$ sudo tshark -i mon0 \
            -T ek \
            -l \
            -e wlan.fc.type \
            -e wlan.fc.type_subtype \
            -e wlan_radio.channel | \
        grep timestamp | \
jq --unbuffered -c '{timestamp: .timestamp} + .layers' {"timestamp":"1583924233530","wlan_fc_type":["0"],"wlan_fc_type_subtype":["4"],"wlan_radio_channel":["2"]}
{"timestamp":"1583924235474","wlan_fc_type":["1"],"wlan_fc_type_subtype":["25"],"wlan_radio_channel":["2"]}
{"timestamp":"1583924235613","wlan_fc_type":["1"],"wlan_fc_type_subtype":["25"],"wlan_radio_channel":["2"]}Streaming Wi-Fi data into Apache Kafka #
Now, let’s stream this data into Kafka. Once it’s in Kafka we can use it for lots of things! We can use Kafka Connect to stream it onwards to places like Elasticsearch, Neo4j, S3. We can write ksqlDB applications to analyse and aggregate it. We can use it to drive services that subscribe to a stream of Wi-Fi data. The world will be our oyster!
Instead of the faff of running Kafka for myself I’m using Confluent Cloud. Its pricing is such that you just pay for the data you use, making it very cheap to start playing around with, especially with the current $50 credit per month for first three months offer. Sign up and create your cluster and get your API key and broker details.
Create a file with your Confluent Cloud details in:
$ cat .env
CCLOUD_BROKER_HOST=foo-bar.us-central1.gcp.confluent.cloud
CCLOUD_API_KEY=XXXXXXXXXXX
CCLOUD_API_SECRET=YYYYYYYYYYYYYYYYYYYYYYYYYYYYYYYYYYYYYYYYYYYYYYYY
We installed kafkacat above, and can now use it to connect to our cloud environment. The -L argument tells kafkacat to do a metadata query across the brokers and topics:
$ source .env
$ kafkacat -X security.protocol=SASL_SSL -X sasl.mechanisms=PLAIN -X api.version.request=true \
            -b ${CCLOUD_BROKER_HOST}:9092 \
            -X sasl.username="${CCLOUD_API_KEY}" \
            -X sasl.password="${CCLOUD_API_SECRET}" \
            -L
Metadata for all topics (from broker -1: sasl_ssl://foobar.us-central1.gcp.confluent.cloud:9092/bootstrap):
18 brokers:
broker 0 at b0-foobar.us-central1.gcp.confluent.cloud:9092
broker 5 at b5-foobar.us-central1.gcp.confluent.cloud:9092
broker 10 at b10-foobar.us-central1.gcp.confluent.cloud:9092
broker 15 at b15-foobar.us-central1.gcp.confluent.cloud:9092
broker 9 at b9-foobar.us-central1.gcp.confluent.cloud:9092
…
8 topics:
topic "wibble" with 6 partitions:
partition 0, leader 13, replicas: 13,2,5, isrs: 13,2,5
partition 1, leader 14, replicas: 14,6,7, isrs: 14,6,7
… Now that this is working, go ahead and create a topic called pcap, either through the Confluent Cloud web UI or the command line tool. It’s important that you create this topic, as auto-topic creation is not enabled on Confluent Cloud.
With the topic created, let’s populate it! We are going to hook up the output from tshark in the previous section with the mighty power of kafkacat courtesy of unix pipes:
sudo tshark -i mon0 \
            -T ek \
            -l \
            -e wlan.fc.type -e wlan.fc.type_subtype -e wlan_radio.channel \
            -e wlan_radio.signal_dbm -e wlan_radio.duration -e wlan.ra \
            -e wlan.ra_resolved -e wlan.da -e wlan.da_resolved \
            -e wlan.ta -e wlan.ta_resolved -e wlan.sa \
            -e wlan.sa_resolved -e wlan.staa -e wlan.staa_resolved \
            -e wlan.tagged.all -e wlan.tag.vendor.data -e wlan.tag.vendor.oui.type \
            -e wlan.tag.oui -e wlan.ssid -e wlan.country_info.code \
            -e wps.device_name |\
    grep timestamp|\
    jq -c '{timestamp: .timestamp} + .layers' |\
    kafkacat -X security.protocol=SASL_SSL -X sasl.mechanisms=PLAIN -X api.version.request=true\
            -b ${CCLOUD_BROKER_HOST}:9092 \
            -X sasl.username="${CCLOUD_API_KEY}" \
            -X sasl.password="${CCLOUD_API_SECRET}" \
            -P \
            -t pcap \
            -T
A few notes about what’s going on here. We’ve added in a bunch more fields from the Wi-Fi payload to capture in tshark. We’re also specifying -P to tell kafkacat to act as producer, -t to specify the topic, and -T to echo the messages to stdout as well as write them to the topic (just like tee does).
With this running you’ll see the messages arriving in the topic, either through kafkacat run as a consumer:
$ kafkacat -X security.protocol=SASL_SSL -X sasl.mechanisms=PLAIN -X api.version.request=true \
           -b ${CCLOUD_BROKER_HOST}:9092 \
           -X sasl.username="${CCLOUD_API_KEY}" -X sasl.password="${CCLOUD_API_SECRET}" \
           -C -t pcap
{"timestamp":"1583925922825","wlan_fc_type":["2"],"wlan_fc_type_subtype":["36"],"wlan_radio_channel":["2"],"wlan_radio_signal_dbm":["-71"],"wlan_radio_duration":["384"],"wlan_ra":["00:11:22:33:44:55"],"wlan_ra_resolved":["00:11:22:33:44:55"],"wlan_da":["00:11:22:33:44:55"],"wlan_da_resolved":["00:11:22:33:44:55"],"wlan_ta":["00:11:22:33:44:55"],"wlan_ta_resolved":["00:11:22:33:44:55"],"wlan_sa":["00:11:22:33:44:55"],"wlan_sa_resolved":["00:11:22:33:44:55"],"wlan_staa":["00:11:22:33:44:55"],"wlan_staa_resolved":["00:11:22:33:44:55"]}
{"timestamp":"1583925941754","wlan_fc_type":["1"],"wlan_fc_type_subtype":["29"],"wlan_radio_channel":["2"],"wlan_radio_signal_dbm":["-71"],"wlan_radio_duration":["272"],"wlan_ra":["00:11:22:33:44:55"],"wlan_ra_resolved":["Comtrend_96:cc:64"]}
{"timestamp":"1583925963170","wlan_fc_type":["1"],"wlan_fc_type_subtype":["28"],"wlan_radio_channel":["2"],"wlan_radio_signal_dbm":["-71"],"wlan_radio_duration":["40"],"wlan_ra":["00:11:22:33:44:55"],"wlan_ra_resolved":["Broadcom_08:04:20"]}
{"timestamp":"1583925991920","wlan_fc_type":["2"],"wlan_fc_type_subtype":["36"],"wlan_radio_channel":["2"],"wlan_radio_signal_dbm":["-79"],"wlan_radio_duration":["384"],"wlan_ra":["00:11:22:33:44:55"],"wlan_ra_resolved":["00:11:22:33:44:55"],"wlan_da":["00:11:22:33:44:55"],"wlan_da_resolved":["00:11:22:33:44:55"],"wlan_ta":["00:11:22:33:44:55"],"wlan_ta_resolved":["00:11:22:33:44:55"],"wlan_sa":["00:11:22:33:44:55"],"wlan_sa_resolved":["00:11:22:33:44:55"],"wlan_staa":["00:11:22:33:44:55"],"wlan_staa_resolved":["00:11:22:33:44:55"]}
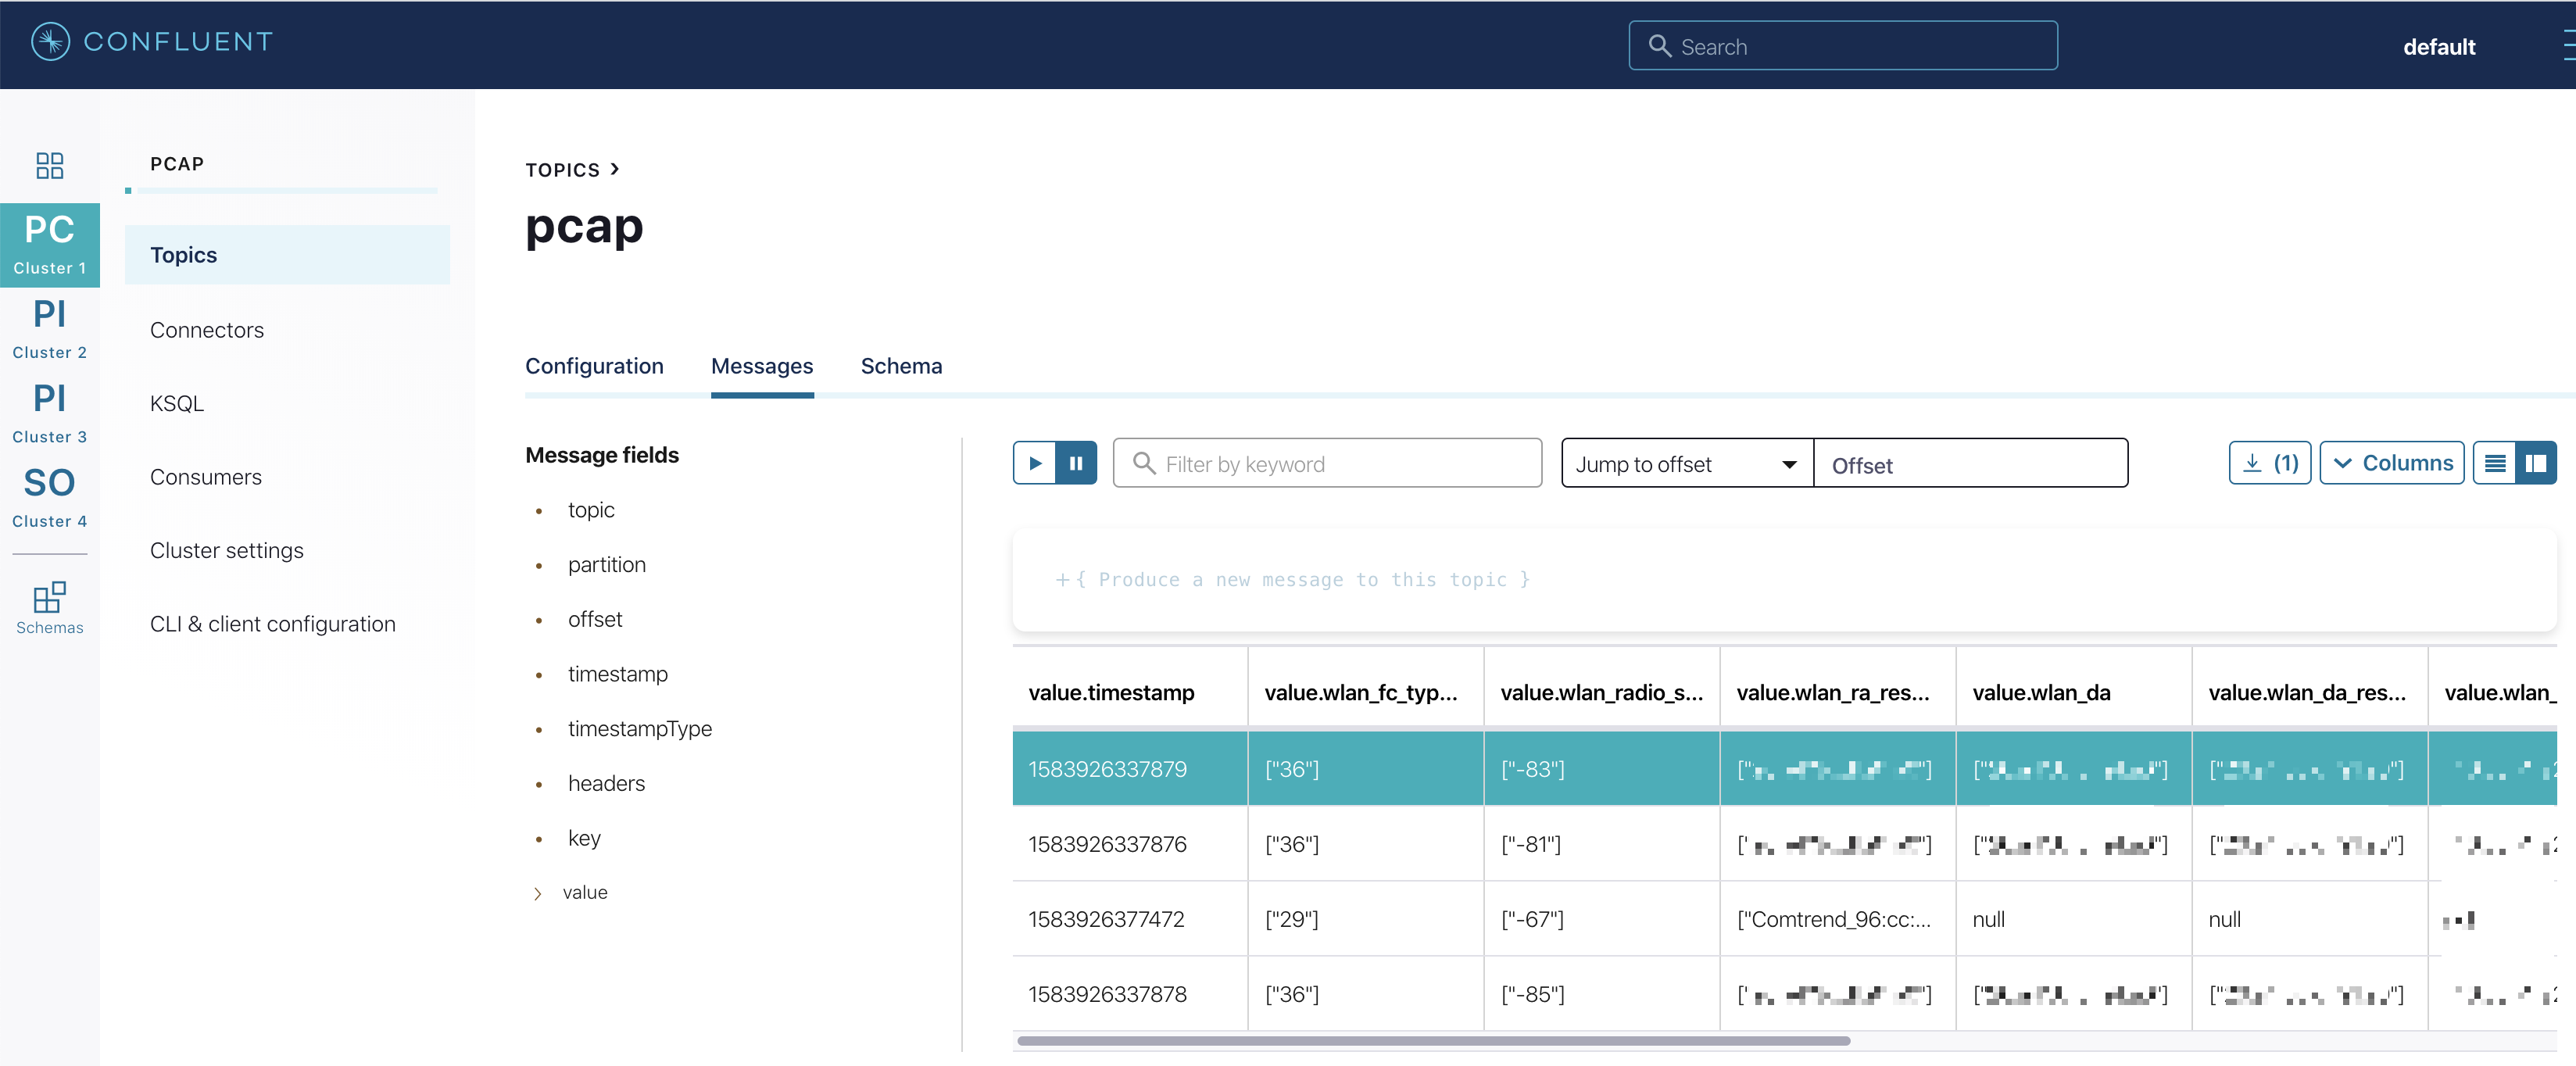
or through the Confluent Cloud UI:

What’s next? #
So now we’ve got the data streaming into Kafka, what’s next? Well, how about some ksqlDB to analyse it:
ksql> SELECT TIMESTAMPTOSTRING(WINDOWSTART,'yyyy-MM-dd HH:mm:ss','Europe/London') AS WINDOW_START_TS,
>       DISTINCT_TA_MACS,
>       DISTINCT_RA_MACS,
>       EVENT_COUNT
>FROM   PROBE_REQUESTS_BY_5MIN
>WHERE  ROWKEY=4
>  AND  WINDOWSTART > '2020-03-11T08:00:00.000'
>  AND  WINDOWSTART <= '2020-03-11T09:00:00.000';
+----------------------+------------------+------------------+-------------+
|WINDOW_START_TS       |DISTINCT_TA_MACS  |DISTINCT_RA_MACS  |EVENT_COUNT  |
+----------------------+------------------+------------------+-------------+
|2020-03-11 08:05:00   |13                |2                 |30           |
|2020-03-11 08:10:00   |15                |1                 |63           |
|2020-03-11 08:15:00   |9                 |2                 |29           |
|2020-03-11 08:20:00   |10                |1                 |28           |
|2020-03-11 08:25:00   |8                 |1                 |37           |
|2020-03-11 08:30:00   |12                |2                 |57           |
|2020-03-11 08:35:00   |14                |1                 |42           |
|2020-03-11 08:40:00   |22                |1                 |77           |
|2020-03-11 08:45:00   |21                |2                 |64           |
|2020-03-11 08:50:00   |10                |1                 |40           |
|2020-03-11 08:55:00   |17                |1                 |58           |
|2020-03-11 09:00:00   |27                |2                 |54           |
Query terminated
ksql>
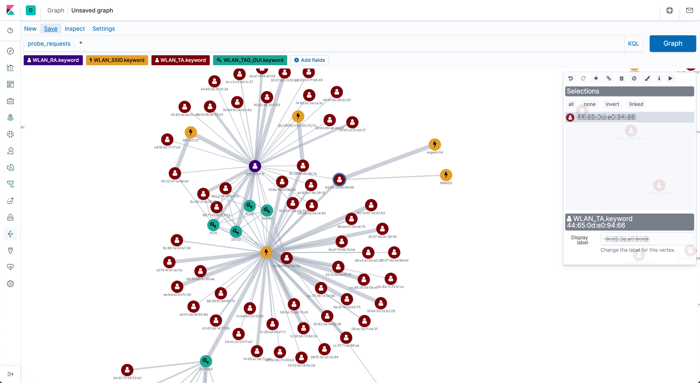
or property graph analysis to look at the relationship between things like SSIDs and devices?

Stay tuned!
